Address
304 North Cardinal
St. Dorchester Center, MA 02124
Work Hours
Monday to Friday: 7AM - 7PM
Weekend: 10AM - 5PM
Address
304 North Cardinal
St. Dorchester Center, MA 02124
Work Hours
Monday to Friday: 7AM - 7PM
Weekend: 10AM - 5PM
Abstract. Research shows that there is a direct correlation between the application of square roots, geometrical structures and time-price relationships in forecasting price movements. By analyzing price levels through geometric principles and numerical relationships, Gann’s approach offers systematic methods for identifying reversals or major support and resistance levels in markets. This can be applied to both individual stocks and indexes like the S&P500. This paper aims to study the correlation between square root increments, angles and price momentum, highlighting their role in forecasting with great accuracy support and resistance levels where we can see important market action at play.
In the world of financial markets technical analysis has long sought mathematical models to predict future price action, this is where W.D Gann’s geometric and time-based forecasting techniques have played a major role among wall street analysis to expose these major price levels and have also helped these forecast where reversals may occur. This paper examines the mathematical rationale behind Gann’s and Jenkin’s approach. We’ll focus on square roots and the relationship between price, time, and geometric formations such as squares and circles to a lesser degree and how these techniques and formulas can be used to have leverage and produce more accurate market forecasts in trending markets.
It’s important to highlight that these methodologies work only in trending markets, and they have not been proven to be used effectively in sideways trending markets, which is one of the limitations of these specific strategies.
This approach is based on the observation that price movements exhibit certain proportional relationships rooted in natural mathematical sequences. For example, if a financial instrument reaches a significant swing low, the square root of that value, when incremented by specific fractional values (e.g., +0.25, +0.5, +1) and subsequently squared again, can provide reliable support and resistance levels.
“The Gann Square of Nine is a well-known number matrix and consists of a spiral arrangement of numbers in a circle that approximates the relationship of the full cycle being the square root incremented by two. In other words a price of 61 if taken the square root (7.81), and incremented by 2 and re-squared (7.81 + 2)^2 equals 96.25, the next number cycle up from that first level. Strong resistance is usually found at the square roots +.75, +1 and +2 or you can use Fibonacci ratios like +.382, or +.618 as increments.” (Basic day trading techniques P.28).
Now, let’s apply this knowledge to a real life example using apple stock as our financial instrument of choice.
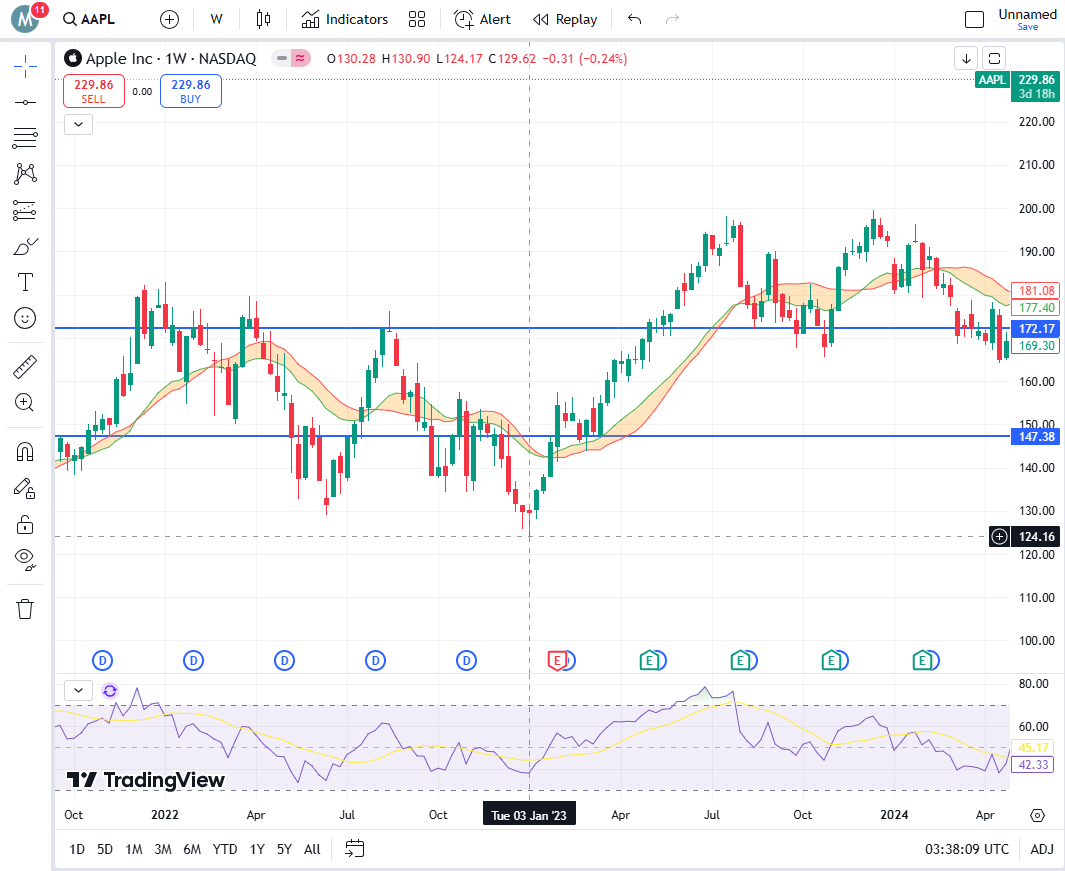
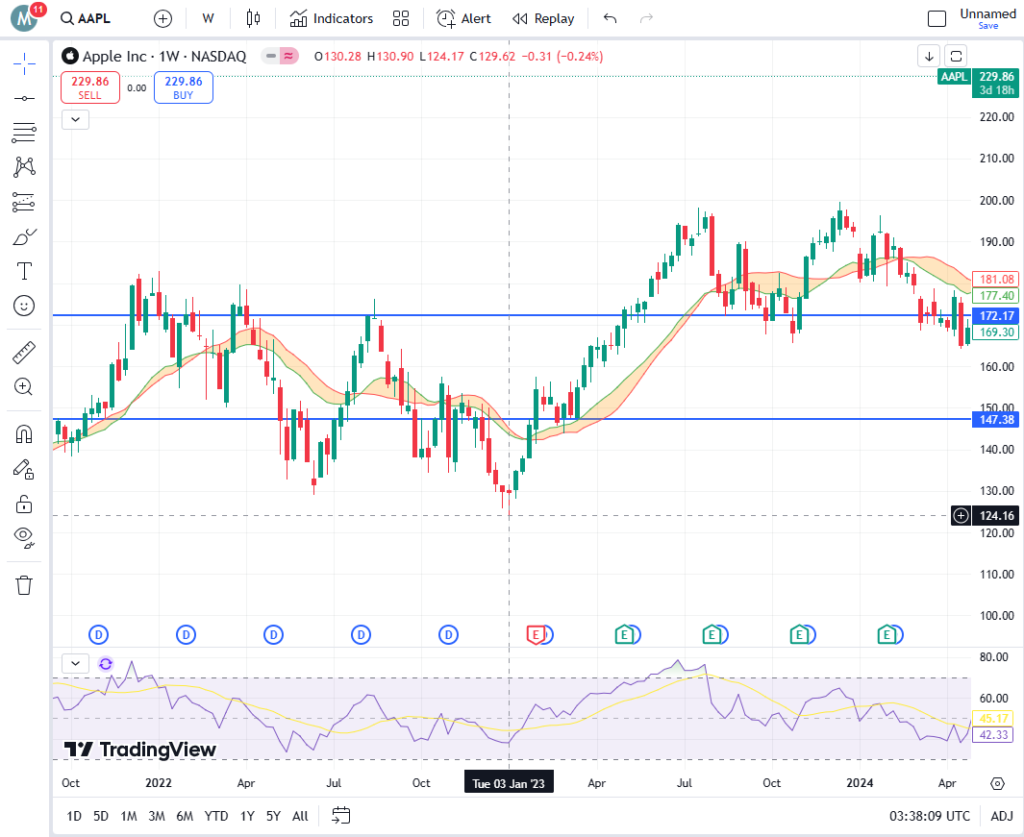
If we take a look at the chart below, we can see that apple stock reached a swing low price of $124usd on Jan 3rd 2024. We will now apply the square root numerical methodology to forecast possible support and resistance levels.
124=11.14\sqrt{124} = 11.14124=11.14
(11.14+2)2=13.142=172.64(11.14 + 2)^2 = 13.14^2 = 172.64(11.14+2)2=13.142=172.64
Key Resistance Level: $172.64
(11.14+0.75)2=11.892=141.42(11.14 + 0.75)^2 = 11.89^2 = 141.42(11.14+0.75)2=11.892=141.42
Resistance at $141.42
(11.14+1)2=12.142=147.37(11.14 + 1)^2 = 12.14^2 = 147.37(11.14+1)2=12.142=147.37
Resistance at $147.37
(11.14+1.618)2=12.762=162.79(11.14 + 1.618)^2 = 12.76^2 = 162.79(11.14+1.618)2=12.762=162.79
Resistance at $162.79
Key takeaway:
$147.37 and $172.64 are key resistance levels for AAPL based on the swing low of $124 using Gann Square of Nine.
As we can see from the example above, this mathematical formula allows us to plot future key resistance levels where apple stock clearly encountered market resistance and further acted as support once resistance levels were broken, specifically on the $172 level, whereas the first major resistance level was accurately calculated at $147.
This is just one example of how square roots and Fibonacci numbers can be used to forecast important price levels in trending markets.
Gann’s analysis is deeply rooted in the interaction between time and price. He proposed that financial markets follow geometric paterns and that by identifying key angles, squares, and circles, traders can determine precise support and resistance levels.
One of W.D Gann’s most notable contributions to technical analysis is the use of angles to track price momentum. The Gann Angles, such as the 1×1 (45-degree) line, represent an equilibrium between time and price movement. Key angles include:
When a price moves along one of these angles, it tends to find resistance or support upon reaching another, making angles essential tools in trend forecasting.
This of course needs to be further studied as there are multiple patterns that can emerge from an angle movement in a trending market, especially considering periods of high volatility when these angle trendlines are constantly broken.
Below we can find an example of an angle trendline (Ref. Basic Day Trading Techniques by Michael S. Jenkins p.35)
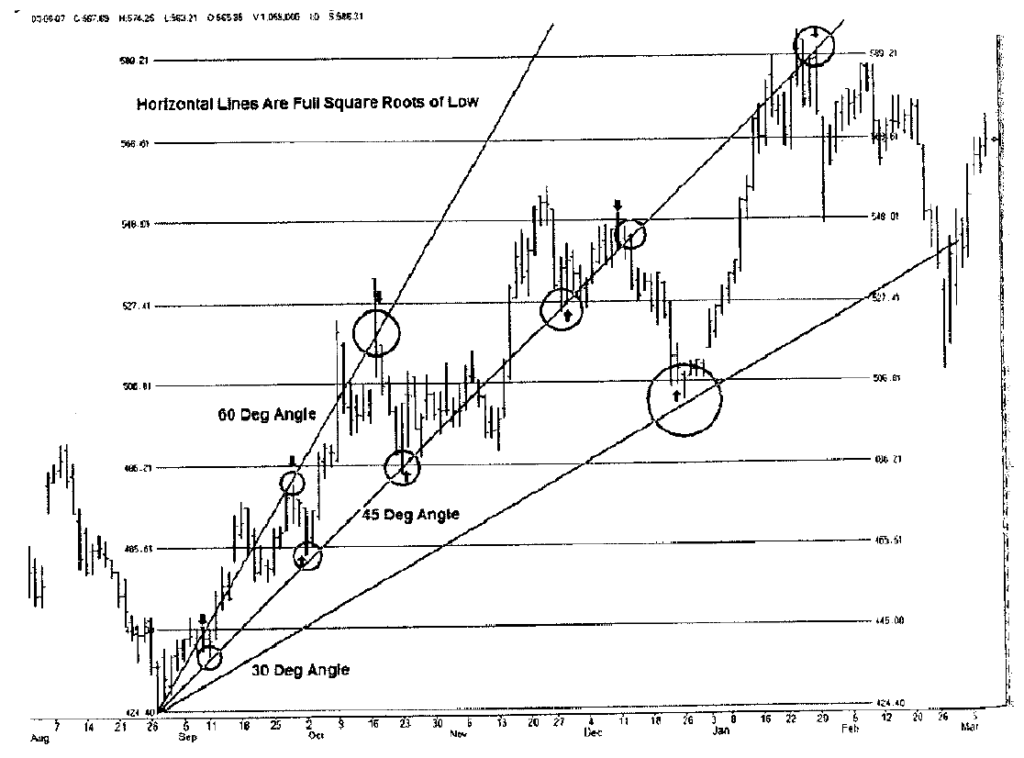
The chart above shows common angles used in technical analysis (30,45 and 60). Also shown on the chart are horizontal lines that are full square root increments from the swing low on Aug 26. The circles areas are there the projected support or resistance levels based on angle momentum should be found and as we can see there is a clear correlation between hits on each one of the angle trendlines meaning whenever price bounces off of the 45 degree angle to the 60 degree angle we tend to see a strong resistance level and then price would retest the 45 degree angle.
On the other hand, if the price breaks the 45 degree angle like we see it happen the 11th of December we can expect price to find its next support on the 30 degree angle. This shows that there is a clear harmonious pattern of support and resistance levels based on these key angles.
Gann emphasized the concept of squaring price with time, this means that if the price of a stock or an index rises by a certain numerical value, it should take a proportional amount of time before reaching equilibrium again. A perfect square occurs when the time elapsed equals the square root of the price range. This principle is used to determine key reversal points in the market.
Now we will take an overlook of one of Gann’s most well-known tools: The square of nine this is a spiral-based chart where numbers progress outward in a square root sequence. The mathematical properties of this tool include:
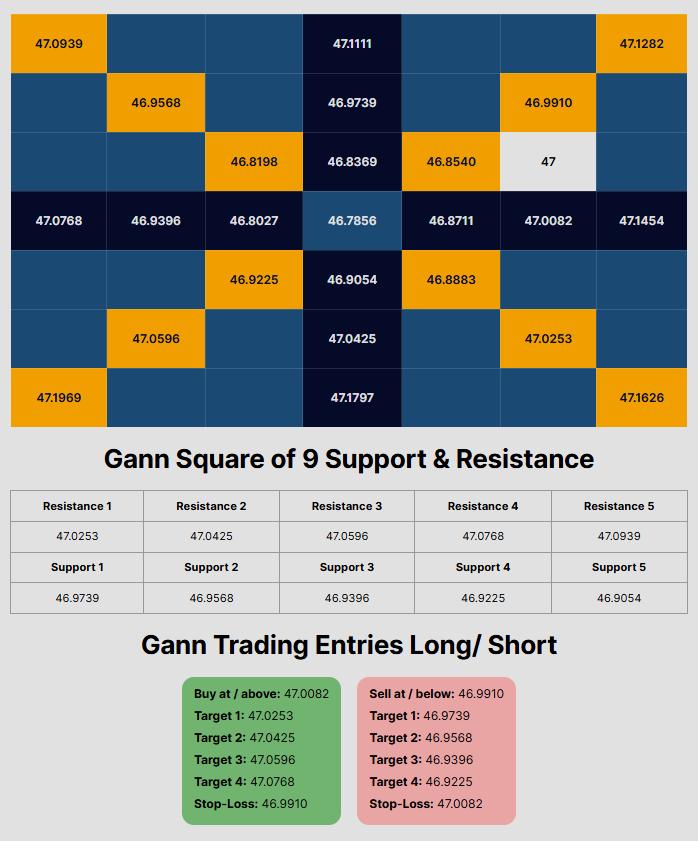
By using the Square of Nine, we can potentially identify high-probability trade setups based on past price movements. This method can be used to provide a structured way for us to analyze market fluctuations, reducing uncertainty and enhancing predictive accuracy.
This paper has demonstrated with a real-life example that the application of square root increments, Fibonacci ratios, and geometric principles discovered by W.D. Gann and Michael S. Jenkins can be highly effective in forecasting support and resistance levels in trending markets. If we take a closer look at the mathematical relationship between price and time us traders could in theory, systematically identify key price levels where reversals and momentum shifts are likely to occur.
The case study we used on Apple stock illustrated above clearly shows how square root calculations can provide precise resistance and support levels, based on the stock’s historical price action. Additionally, the role of Gann angles and the Square of Nine can serve to reinforce the idea that price movements are not random but follow predictable mathematical structures based on natural patterns. However, as discussed, these methodologies are most effective in trending markets and may not be reliable in sideways trending markets or highly volatile conditions, although more research is needed on this matter.
Future research could focus on integrating these quantitative techniques with modern computational methods, such as machine learning and algorithmic trading, to improve accuracy and adaptability in diverse market conditions. By combining historical market patterns with advanced analytics, the predictive power of these classical forecasting tools can be further enhanced, offering traders a robust framework for market analysis.
Gann, W. D. (1927). The Tunnel Thru the Air. Jenkins, M. S. (2007). Basic Day Trading Techniques.


