Address
304 North Cardinal
St. Dorchester Center, MA 02124
Work Hours
Monday to Friday: 7AM - 7PM
Weekend: 10AM - 5PM
Address
304 North Cardinal
St. Dorchester Center, MA 02124
Work Hours
Monday to Friday: 7AM - 7PM
Weekend: 10AM - 5PM

THERE HAS BEEN a lot of speculation lately on how the US Federal Reserve will react this 2025 with all the current geopolitical tensions and pressures by US President Donald Trump. The US Fed monetary policy in 2025 will play a crucial role in shaping the economic landscape of the United States. Whether you’re an investor, business owner, or someone just trying to understand the economy, the Fed’s actions affect everything from your mortgage rates to your retirement savings.
The Fed has a wide range of tools such as interest and open market operations to influence the economy, but just how do they make these decisions? Why does the fed sometimes raise or lower interest rates? Let’s start by giving a small recap of what monetary policy is and the types of monetary policy.
WHETHER OR NOT the Fed switches to back to QE depends on a number of factors I will outline below, and as we’ve seen lately this economic cycle has been trickier to navigate due to the recent change in the U.S government administration which saw Donald Trump elected as the 47th president of the United States.
His administration is introducing several highly controversial policies which consists on tax cuts for American companies that manufacture products in the U.S, tariffs for foreign goods completely bypassing some trade agreements like the USMCA.
This on the macro side of U.S economic policy could see inflation rise as we’ve seen in the first 3 months of 2025 according to the Fed’s PCE reports shown below.
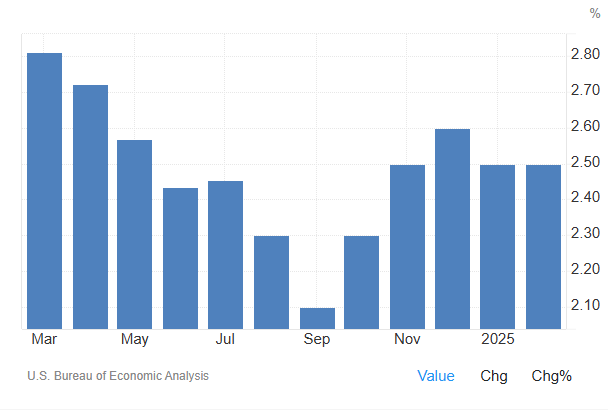
Donald Trump could be playing a risky game with tariffs, tax cuts and inflation. One hypothesis is that by raising tariffs short-term the U.S economy might
TARIFFS ARE BY NATURE inflationary because they raise the cost of imported goods which are then passed onto the consumer. This could, however, also reduce demand for foreign products while boosting demand for American-made goods.
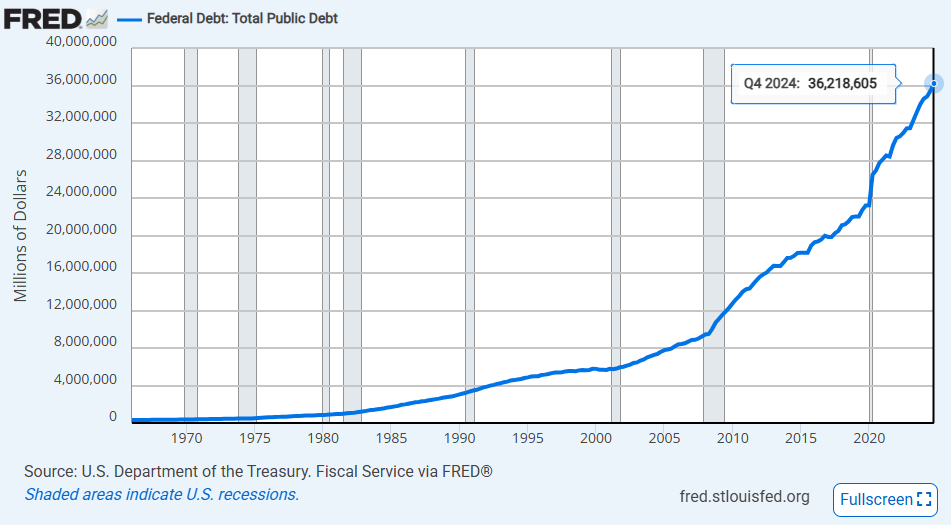
At first glance, higher tariffs may seem like a purely inflationary move, one that risks pushing the economy toward recession, but my point is that there may be a deeper strategy at play, especially concerning the U.S. national debt.
Trump has long pressured the Fed to cut interest rates, and now, with inflation fears easing, the Fed has begun lowering them. If tariffs trigger a short-term inflationary spike, followed by a recession and rising unemployment, inflation could cool once again, and this will cause the Fed to lower rates again to stimulate the U.S economy.
LOWERING INTEREST RATES would make refinancing the U.S. debt much cheaper. If Trump’s policies (Tariffs included) could indirectly force the Fed into a more dovish stance, it could ease the government’s debt burden in the long run.
Could this be the plan? Or just an unintended side effect? Either way, the interplay between tariffs, inflation, and Fed policy could have major implications for the economy, some negative if not properly managed but if Trump’s policies work and the U.S economy goes into recession but manages to ease the national debt this could save the U.S from a larger debt crisis in the not so distant future.
COMMONLY KNOWN AS “QE” (Short for the fancy term ‘Quantitative Tightening’). Expansionary monetary policy when the economy slows down or enters a recession. The Fed lowers interest rates to make borrowing cheaper, hoping that businesses and consumers will spend and invest more. When people borrow more, the economy grows, and inflation tends to rise.
Inflation is the main risk that is keeping the Fed from lowering interest rates further this year.
This type of policy aims to “stimulate” the economy. I like to use Mr. Adam Khoo’s car example to explain this: Imagine you are on a highway, but the car is starting to slow down, if the car slows down too much you run the risk of crashing so what do you do? You step on the gas of course. Similarly, when the economy is weak or is slowing down, the Fed makes it cheaper to borrow money by lowering interest rates and thus money flows to the economy once again.
Interesting Fact: In 2008, during the global financial crisis, the Fed slashed rates to nearly zero as part of an expansionary policy to rescue the economy. It was the first time in history the Fed had taken such drastic action.
ON THE OTHER hand, the Fed switches to a contractionary monetary (Quantitative Tightening) policy when the economy “overheats” and inflation is rising to unsustainable levels. The Fed raises rates to make borrowing money more expensive, this slowing down spending and investment. This helps cool off an economy with unsustainably rising prices.
Again, using the analogy of the car, think of it like this: The car is now going too fast, engine is overheating so what do you do? You step on the break of course! Rising interest rates and making borrowing money more expensive helps reduce inflation back to more stable levels.
When the Fed switches to QT they’re essentially sucking money out of the economy to fight inflation
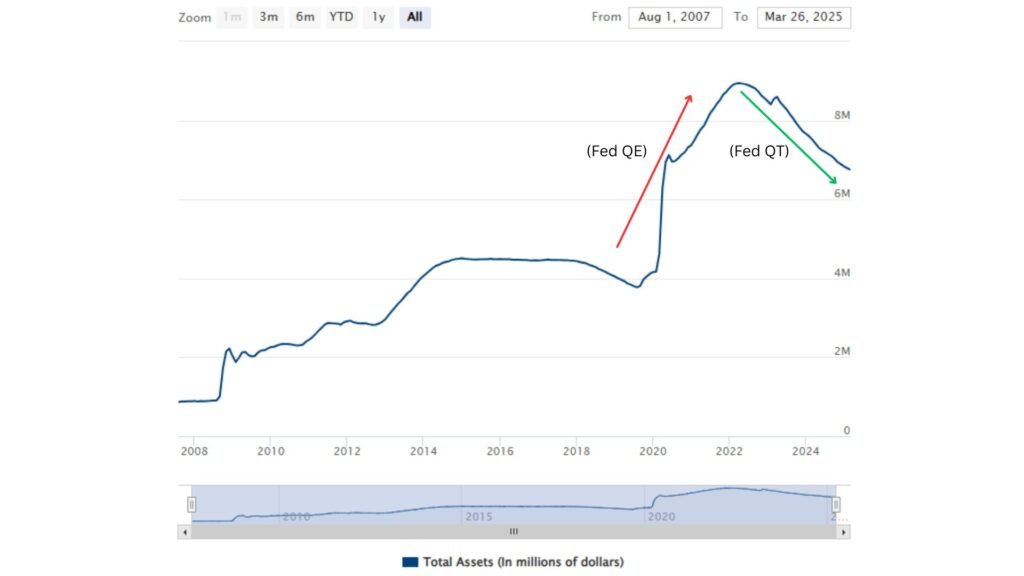
The Fed stops reinvesting proceeds from maturing bonds which causes the money supply to shrink, this can be in the Fed’s balance sheet graph as a downward slope like shown in the Red line above, while QE can be seen on the Fed’s balance sheet as a slope up.
THE FED SWITCHES between these policies depending on how the economy is performing and is likely to perform in the future. If the economy is growing too quickly and inflation continues to rise at an alarming rate then contractionary policy might be used to cool the economy.
On the other hand, if the economy is struggling, unemployment rises, and inflation does not pose a serious threat then the Fed might switch to an expansionary monetary policy to stimulate economic growth.
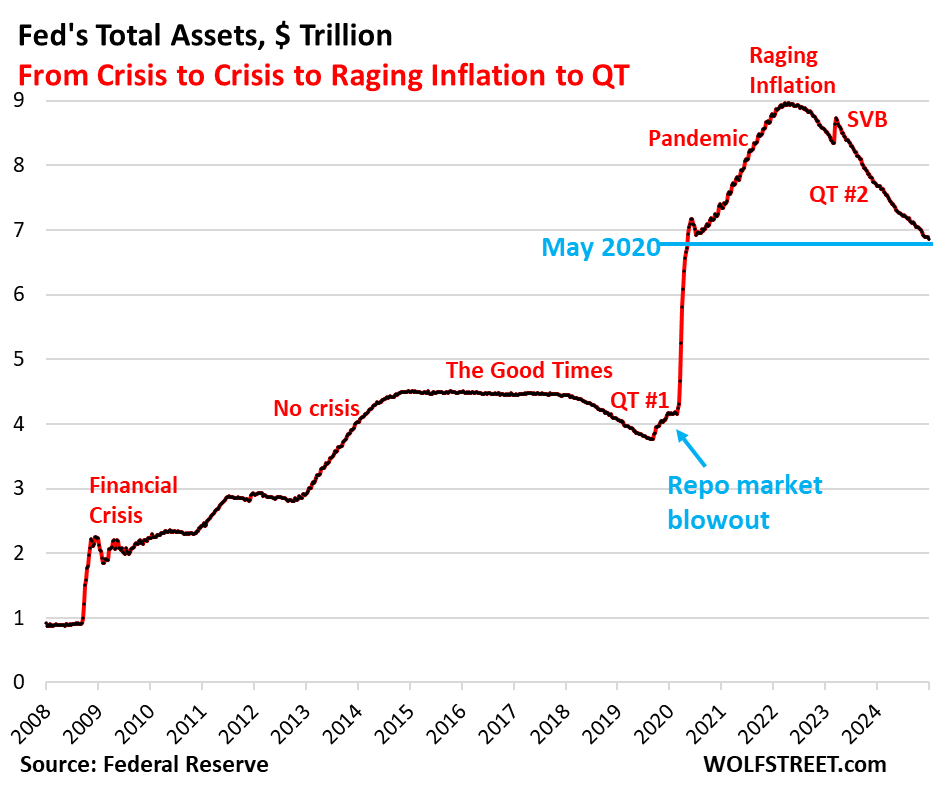
AS OF 2024, the Federal Reserve had been increasing interest rates in response to high inflation following the 2020 crash when they “printed” around 3.3 trillion dollars to handle the economic downturn caused by the pandemic.
Now with a second Trump presidency and rising geopolitical tensions the fed has (for now) decided to continue its QT policy. The question would now be: Well, how much longer will the fed do QT until it switches to QE?
I don’t have a crystal ball (Although I wish I did) but given the current macro trends with inflation still on the rise and Trump’s inflationary policies I do not see the Fed switching to QE anytime soon at least for the next 2 quarters.
Unless some black swan event happens like a cyberattack, energy crisis or maybe a tariff-induced recession? the economy is still looking strong according to Powell’s words last FOMC meeting on March 18 2025.
IN MY OPINION we’re could already in the beginning stages of a recession, and this is due not only to Trump’s tariffs but the continuous Q1 GDP growth projections by the Atlanta Fed which have projected negative GDP growth in 2025.
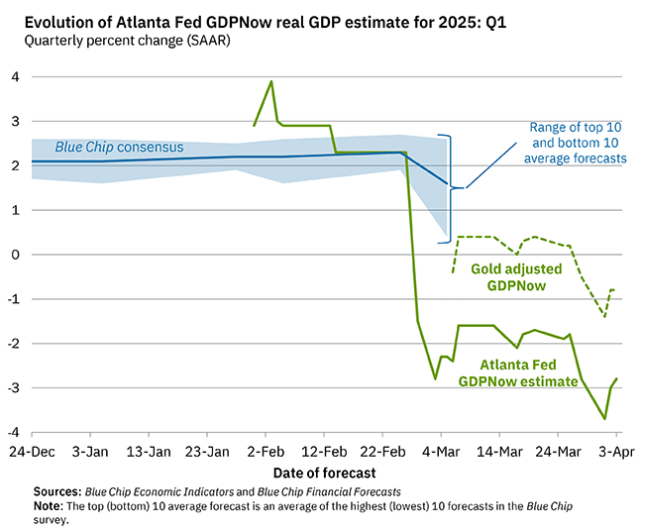
The Atlanta Fed is projecting a -2.8 GDP growth for Q1 2025 and we can already see a selloff in the equities markets. To be fair, I did in fact think this was a normal correction but I do speculate that the Atlanta Fed might be correct about their negative GDP projection for Q1 2025, furthermore, we have seen economists call for recession since 2022 during the Biden administration, and although we did have negative GDP growth in Q1 2022 we did apparently see further growth during 20222 according to the U.S. Bureau of economic analysis.
Recessions are not easily forecasted and speculating on a stock market sell off is much more difficult since markets price recessions way before the actual statement is made by U.S. officials.
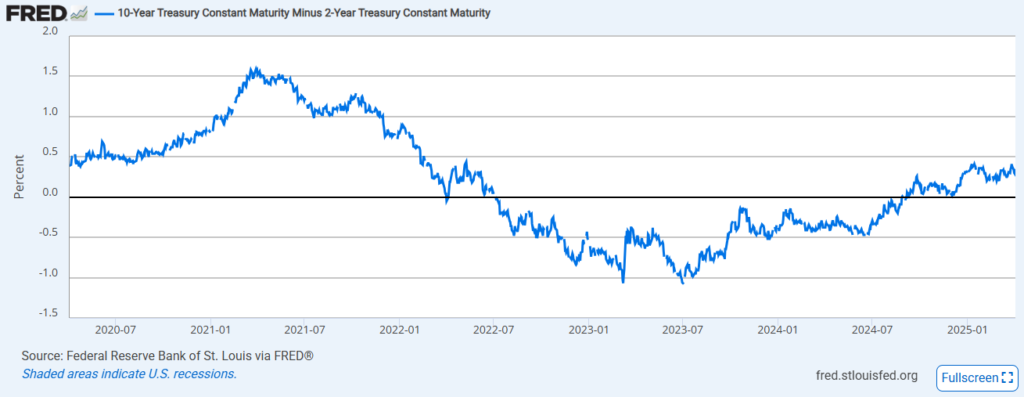
ANOTHER POINT I want to make to hold up my thesis is that the yield curve has been reinverted for about 6 months now if we take a look at the 10-year minus 2-year treasury constant maturity (linked here).
And while it is true that the Fed’s most precise indicator for the yield curve is the 10 year minus the 3-month constant maturity (Shown below) the fact is that both these possible recession indicators have already been reinverted although the latter has only reinverted for about 10 days until now.
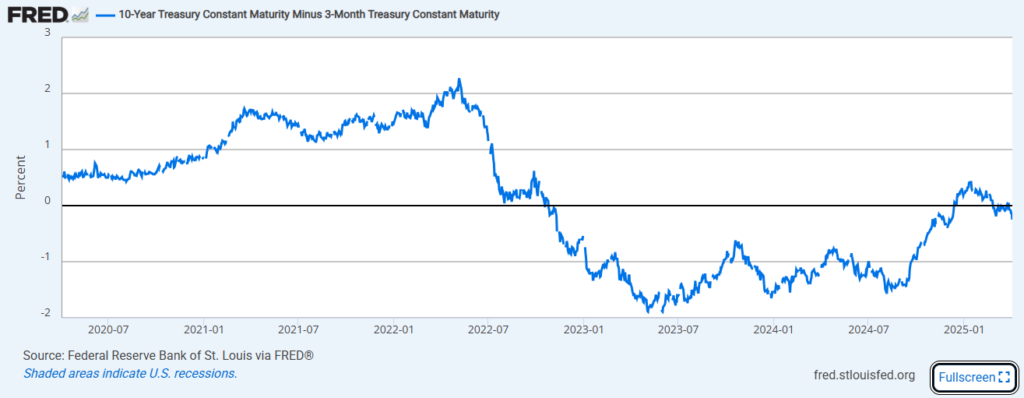
The yield curve is a great indicator for recessions, but it is not until AFTER yield curve uninversion that the economy takes a tumble, this happens approximately 7 months after the yield curve uninverts.
In this next graph we’ll see how when the yield curve uninverts, every single time since 1982 we’ve seen a recession hit shortly after yield curve uninversion.
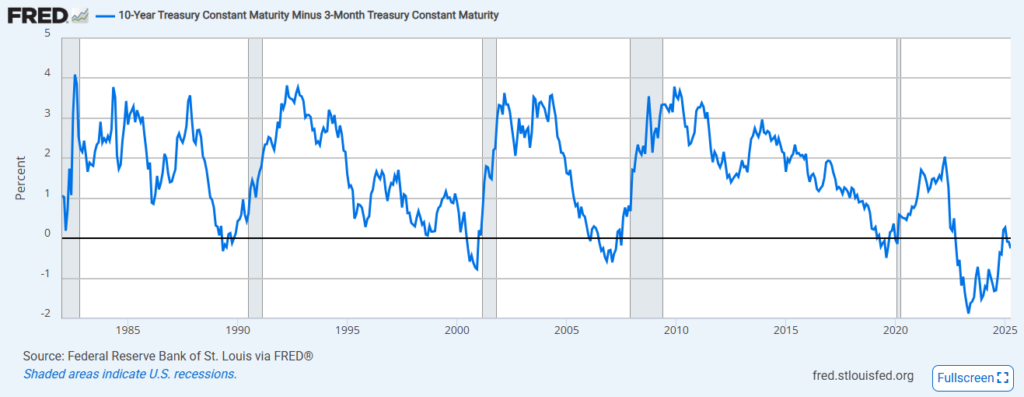
This is historical hard data and seeing as this has been the historic trend for the last 70+ years, and the only time an uninverted yield curve has not led to a recession was in 1989 when the 10 year minus the 2 year constant maturity yield spread gave a brief false negative, this means that the inverted yield curve has preceded a recession with over 90% accuracy!
I WILL NOT GO into why the yield curve uninversion preceeds a recession, I think this is a topic for another article, but I can say with certainty that this is probably the most important data point when analyzing economic data for recession indicators (Apart from inflation, unemployment etc.)
We can use this data points to hedge our risk exposure in financial markets by maybe cutting our equities allocation and moving that capital to short term treasury notes just like legendary investor Warren Buffett has been doing for the last year and half.
There’s been a reason why Buffett has been stockpiling cash making Berkshire Hathaway the company with the biggest cash reserves in the world right now, we may have come to see the reason why he was making this move. That’s why the phrase “Staying ahead of the curve” is such a popular phrase among legendary investors.
Other risk metrics are still not flashing the red lights, but I think it is only a matter of time before the economy really starts to slow down. When this happens, the Fed will inevitably have to step up and start stimulating the economy and that is precisely when we might see an end to QT and perhaps even switch to a moderate policy of quantitative easing (QE).
ALL IN ALL navigating the market in 2025 may prove to be challenging, with economic uncertainty due to trade wars, further conflict in Europe and the middle east and growing inflation numbers the possibility of returning to QE is not yet in our radar as of now. We as investors should monitor key indicators like PCE inflation reports, job market data and real GDP growth to stay ahead of the curve when it comes to economic downturns. The stock market itself is another indicator of a slowing economy as the market prices in events before they happen, and while this recent correction may just that, a correction, we should not rule out further drops, especially if we see the market make lower lows in daily and monthly time frames.
I will leave some resources investors can consult to keep up with the latest economic data, it will help us stay informed and cautious about our next moves when navigating the markets.
I hope this post has been of help to you. If you have any questions or inquiries, please leave a comment, or email us on our contact page, we’ll be happy to get back to you. Have a wonderful day!
Fed Balance sheet: https://www.federalreserve.gov/monetarypolicy/bst_recenttrends.htm
Atlanta Fed GDP NOW projection: https://www.atlantafed.org/cqer/research/gdpnow
Yield Curve 10 Year minus 3 month constant maturity: https://fred.stlouisfed.org/series/T10Y3M
Yield Curve 10 Year minus 2 year constant maturity: https://fred.stlouisfed.org/series/GFDEBTN
U.S. PCE inflation report graph: https://tradingeconomics.com/united-states/pce-price-index-annual-change
WolfStreet Article on QT: https://wolfstreet.com/2025/01/02/fed-balance-sheet-qt-43-billion-in-december-2-11-trillion-from-peak-to-6-85-trillion-bank-panic-facility-btfp-nearly-gone
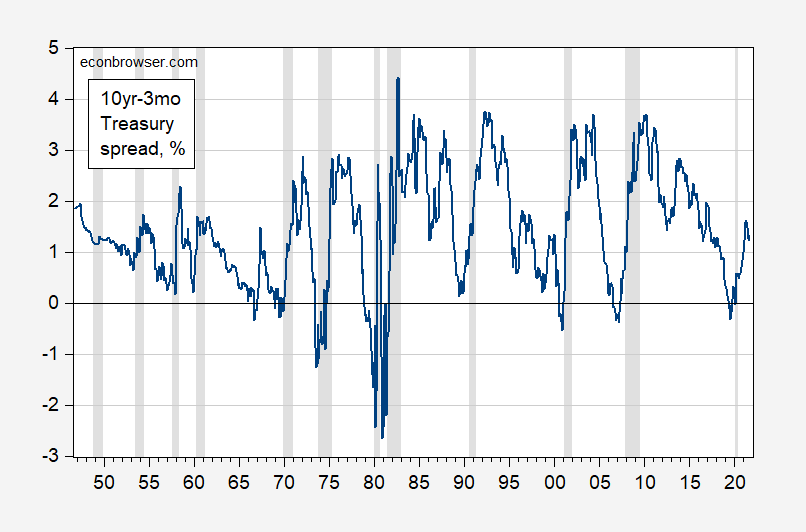
Historical 10 year minus 2 year constant maturity spread (1950-2020): https://econbrowser.com/archives/2021/10/the-10-year-3-month-treasury-spread-over-75-years